Prepare your Excel file
Create a table
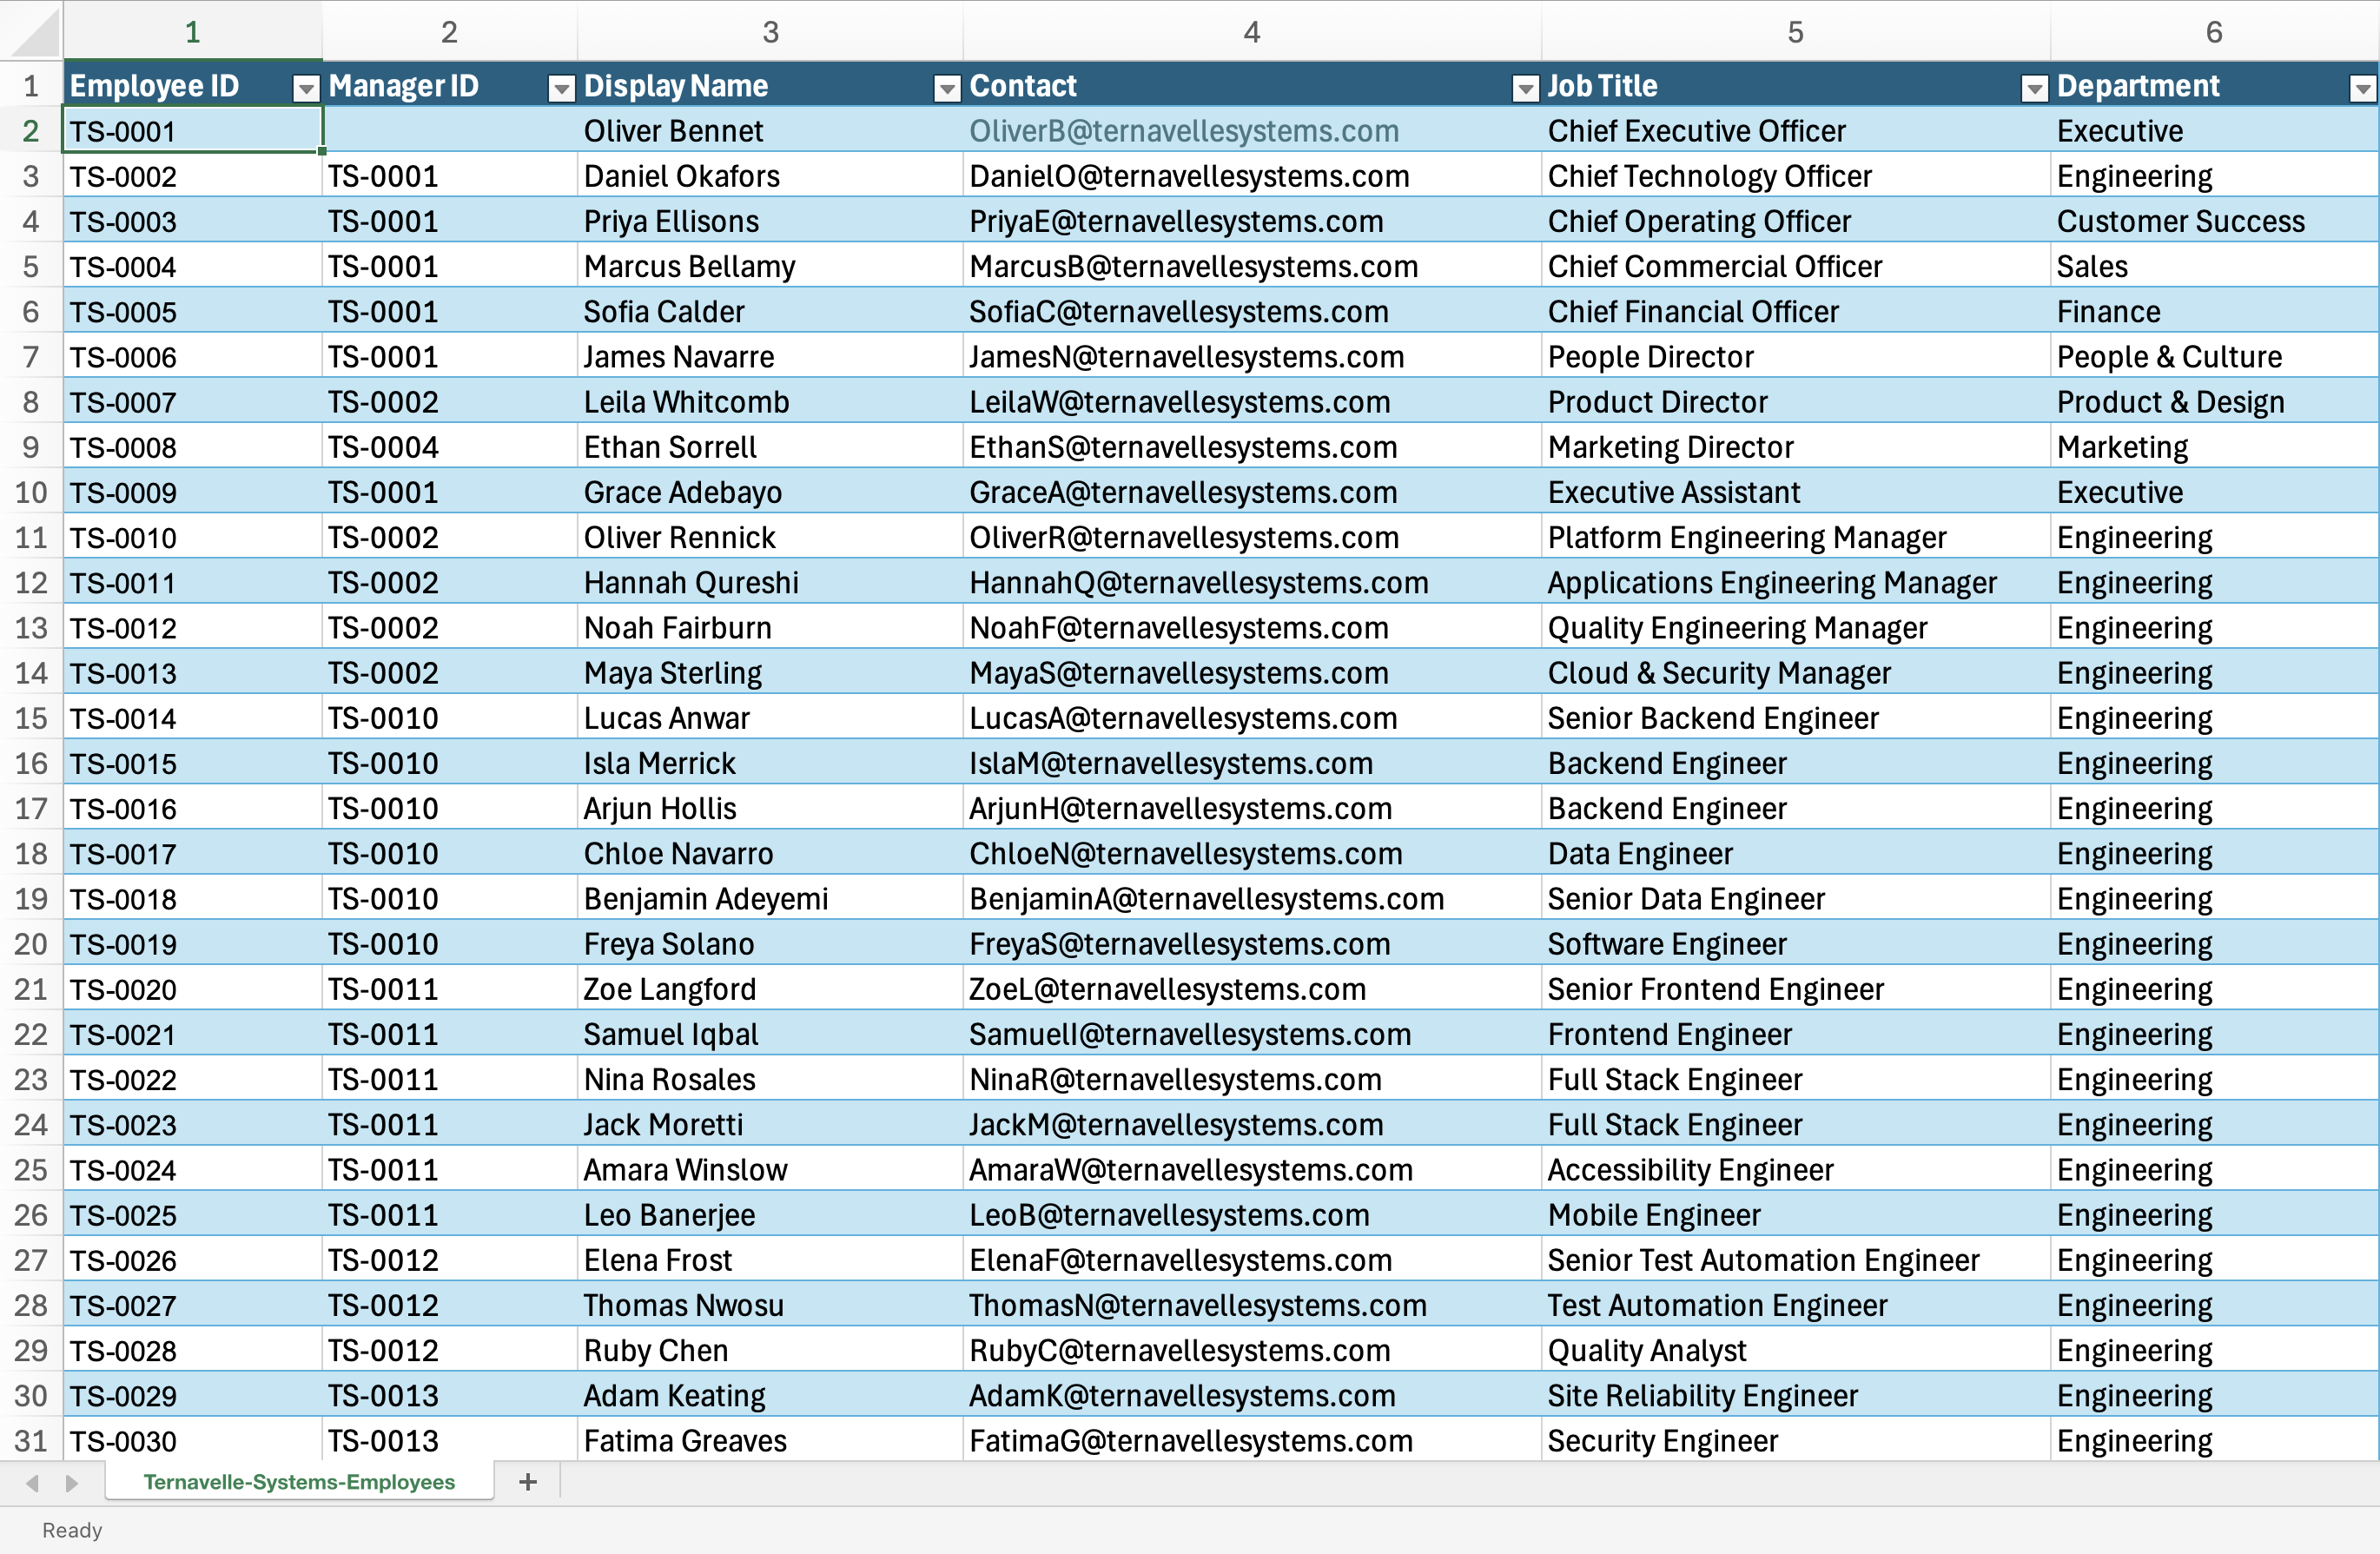
Organize the data as a single Excel table with one person on each row.
- Use the first row for column headings.
- Give every column a clear, unique heading.
- Avoid merged cells, decorative rows, subtotals, and blank rows inside the table.
- Keep one value in each cell rather than combining several pieces of information.
Add employee and manager identifiers
The employee identifier uniquely identifies each person. The manager identifier connects that person to their manager by matching the manager's employee identifier.
- Use a stable, unique employee identifier, such as an employee number or work email address.
- Avoid names because more than one person can have the same name.
- Use the same format in both columns and remove accidental spaces.
- Leave the manager identifier blank only for the person at the top of the chart.
- Make sure every other manager identifier matches an employee identifier in the table.
The employee and manager identifiers must use different columns, but the values in both columns must use the same format, such as employee numbers or work email addresses.
Add information to display
Add separate columns for the information you want to display, search, filter, or format in the chart.
- Use descriptive headings such as Name, Job title, Department, Location, and Email.
- Keep each type of information in its own column.
- Use consistent spelling and values so filtering and formatting behave predictably.
- Only include columns that are useful for the chart or related Excel analysis.
Check your data
After creating the chart, open Data health to find common problems that can produce an incomplete or incorrect hierarchy.
- Run all checks for a quick review of the table.
- Review duplicate identifiers, missing managers, circular reporting lines, and blank values.
- Use Filter table on a check to find the affected rows in Excel.