Conditional rules
What is a conditional rule?
A conditional rule automatically changes the appearance of chart boxes when information in your Excel table matches selected values. This lets you highlight groups of people consistently without formatting each chart box individually.
For example, you could give everyone in the Sales department a blue background, add a border to people in a particular location, or fade out roles that are not relevant to the current view.
Conditional rules only change how the chart looks. They do not change your Excel data or the reporting hierarchy.
How conditional rules work
Each rule checks a column in the source table, such as Department, Location, or Job title. When a person's value in that column matches one of the values selected in the rule, OrgCharts for Excel applies the chosen formatting to their chart box.
A person can match more than one rule. When rules overlap, later rules take priority over earlier rules, so arrange them in the order you want them to be applied.
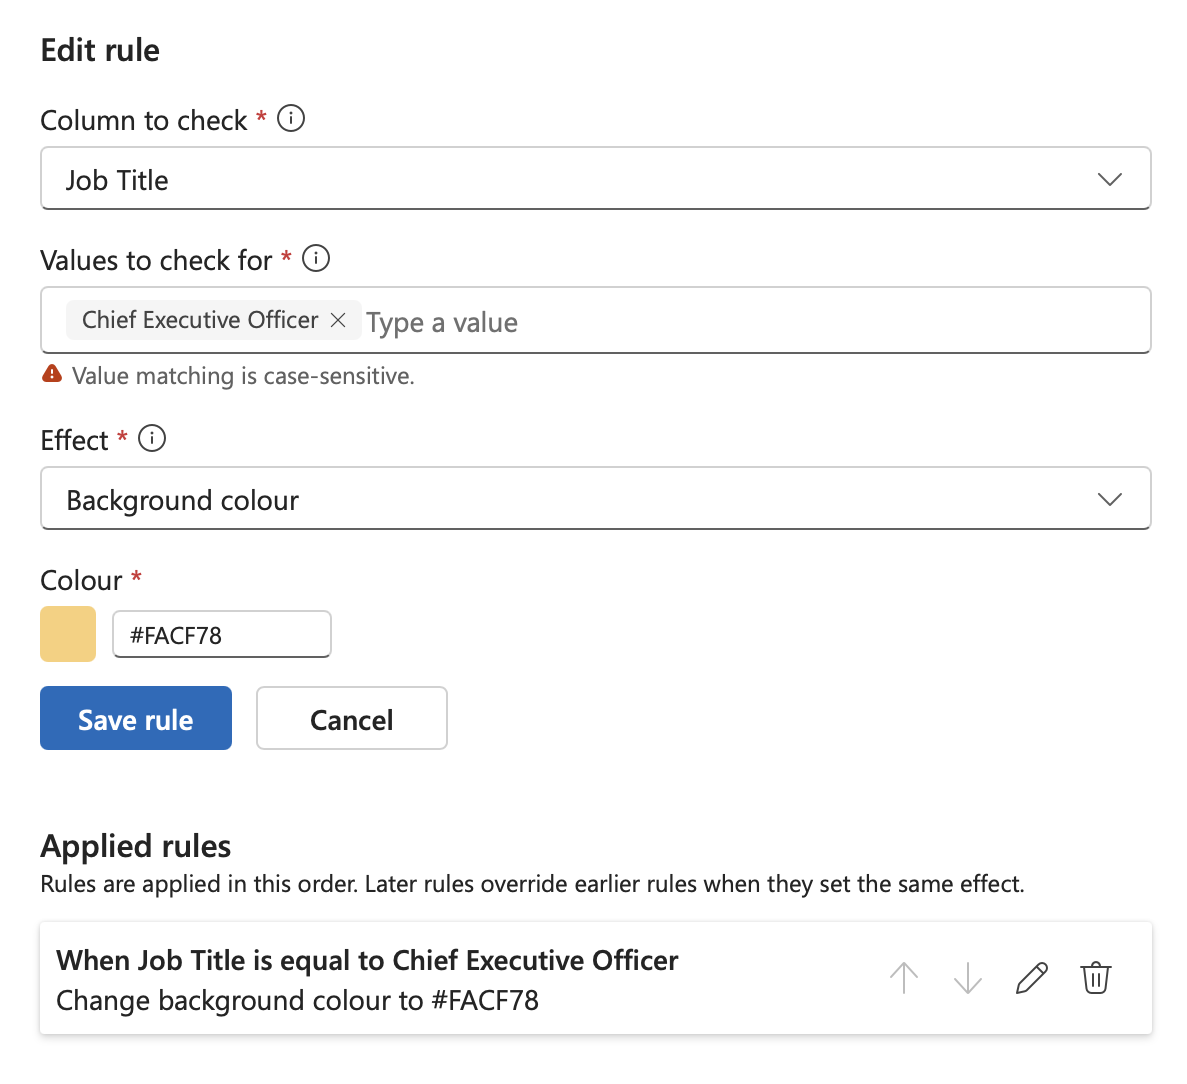
Create a conditional rule
- Open Rules and select the column and values to match.
- Choose a background color, border color, or fade-out effect.
- Add the rule and review the result in the chart.
- Review the order of any overlapping rules and move them if needed.