Calculating Team Budgets with Excel

Follow these straightforward steps to quickly and accurately calculate salary and training budgets across your organizational hierarchy using OrgChart4XL.

Using OrgChart4XL simplifies what would otherwise be challenging manual filtering, providing rapid insights into team budgets at every level of your organizational hierarchy.

For this guide, we use the spreadsheet SimpleBudgetOrgChartTemplate.xlsx, which you can download.

Getting Set Up

Install Org Chart for Excel from Microsoft AppSource

OrgChart4XL is a Microsoft Office Add-In for Excel, enabling you to create and share organization charts effortlessly.

OrgChart4XL add-in listing on Microsoft AppSource showing Excel compatibility and download button.

Installation should be automatic and quick.

For this guide, we use the spreadsheet SimpleBudgetOrgChartTemplate.xlsx, which you can download.

Using OrgChart for Excel to Filter Your Table

Prepare Your Data Table

Ensure your Excel table includes clear columns for employee identifiers (such as Email), manager identifiers (such as ManagerEmail), and financial information like Base Salary and Training Budget.

Excel table with employee info; Sales Manager (West) cell is selected.

Calculate Finance Totals Using Excel Table Totals

Activate Excel's built-in Table Totals feature to immediately calculate and summarize financial metrics like total Base Salary or Training Budget for the selected team.

Excel table showing salary and training budget totals with a summary dropdown open.

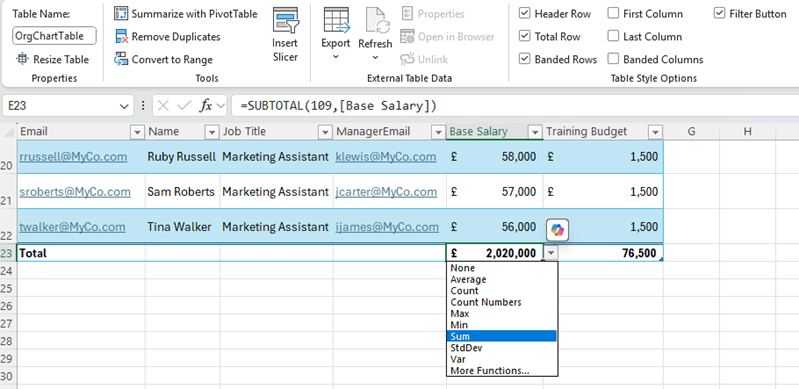
Select your table in Excel, then choose Table Design from the top menu and ensure you check Total Row from the list of options.

This is a powerful Excel feature, and when used with filters, it allows you to quickly view totals for sections of your team.

However, Excel works on tables, not hierarchies, making it difficult to filter the table down to a specific branch of the organizational structure.

Open OrgChart4XL and Select Your Data

OrgChartXL panel showing suggested table settings for chart generation.

On the Excel Home ribbon, launch the OrgChart4XL Add-In. Use the Suggest Configuration wizard to select your data table.

This allows you to quickly visualize your employee data as an organization chart.

For more detailed steps on configuring the chart, refer to Quickly Configure Your Org Chart.

Automatically Filter Data by Org Chart View

Enable the Filter Table to Chart option from the OrgChart4XL toolbar. This automatically filters your Excel data to include only employees visible in the current chart view.

OrgChartXL interface with filter-to-chart option highlighted and visible chart start.

Navigate to the Relevant Organization Location

Use the interactive organization chart to explore teams or departments. The Excel table will be automatically filtered to show only the people visible in the current org chart view.

Excel table and OrgChartXL displaying a marketing team org chart.

Excel will display the totals for that portion of the org chart. Use the Show Level and Hide Level controls on the toolbar to further restrict or expand the visible portion of the chart.

Next Steps