Creating An Org Chart Using TeamOrgChart
You can use TeamOrgChart to manually create an organization chart. This guide shows you the basic steps.
Select Create New Chart
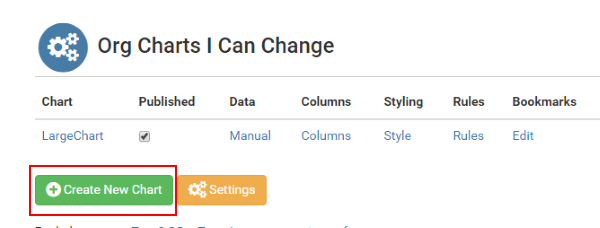
From the Home page select the Create New Chart option.
Choose the Chart Type
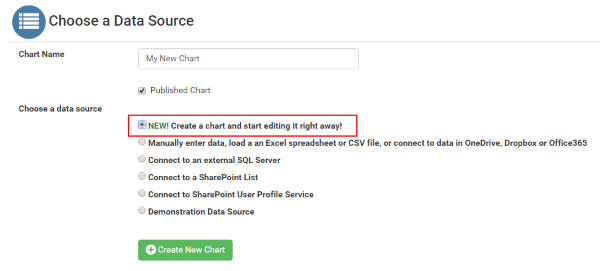
Select the first option on the Choose a Data Source page and enter a name for your organization chart.
Adding the first Items to the Chart

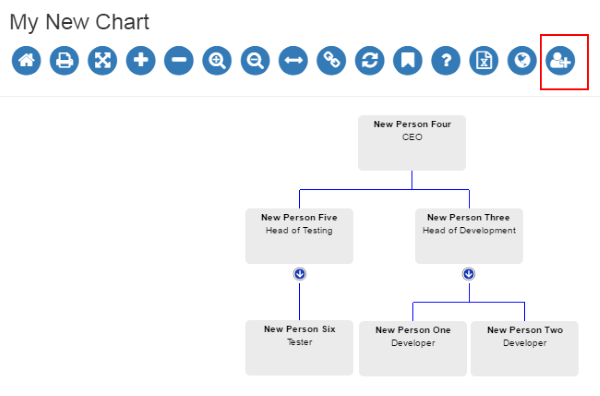
After pressing the Create New Chart button an new organization chart will be created. It contains a single box, sometimes referred to as the "Root" or "Apex".
The box has 4 options:
- Green + button - This is the "Quick Create button" and it creates a "Child" or direct report of the current box immediately.
- Red + button - This shows a simple pop-up window and lets you fill in details of the position to be created.
- Edit Link - Shows a simplified edit page to allow you to set the name, title to be displayed within the chart boxes.
- Remove Link - Removes the box from the chart.
Quickly Adding Items
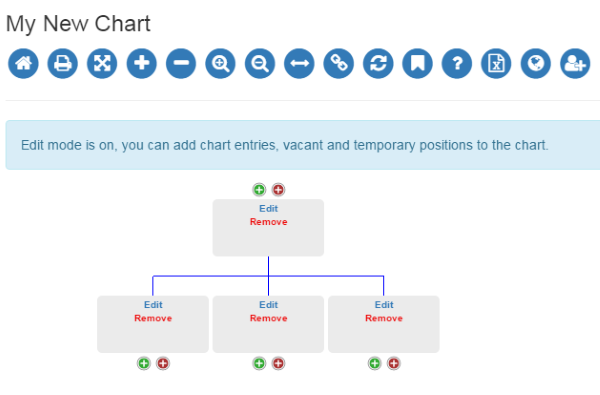
Pressing the Green + button quickly creates new items. You have the opportunity to fill in details later. Using the Quick Add is useful for rapidly creating the outline of your organization structure.
In the example the user has pressed the Quick Add three times, creating three new boxes below the "Root".
Adding Boxes with Details

Using the Red + button you can opt to add a new box and fill in the box details at the same time.
Pressing the Red + displays the Create Chart Entry window and allows you to enter details of the position. ws
Filling In the Details
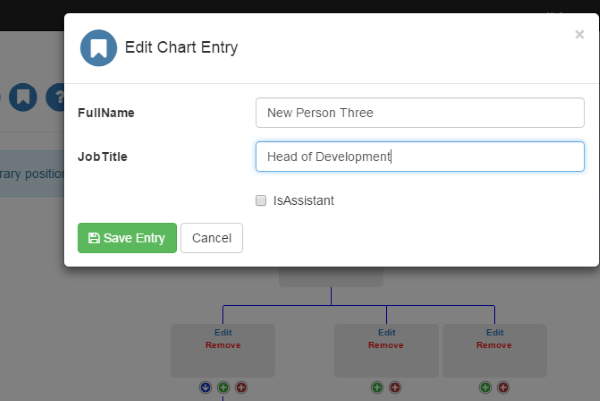
Clicking the Edit Link on an empty box shows the Edit Chart Entry window. This allows you to fill in the details of the chart boxes.
For a box that is already filled in clicking anywhere on the background brings up the window.
HINT : You can choose what should be displayed in the chart boxes by going to the Columns page.
Repositioning Chart Boxes

As you are creating your chart you may wish to reposition chart boxes. This can be achieved by simply dragging a box and dropping it onto the box that you wish to move it to.
Leaving and Restarting the Edit Mode
Once you chart has been completed you can simply exit the edit mode by clicking the Edit button in the tool bar. You can re-enter edit mode at any time using the same button.