Changing the Contents of Chart Boxes
TeamOrgChart allows you to select which columns from your data will be shown within the chart boxes.
This is accomplished via the Columns page that can be accessed from the home page within the Org Charts I Can Change table.
If you cannot see this table then you do not have the appropriate rights required to make the change and will need to contact your administrator to be granted permission to make the changes.
Accessing the Columns Page

To access the Columns page click the Columns link on the home page for the chart that you would like to change. Alternatively you can access the page via the Settings menu on the chart page itself.
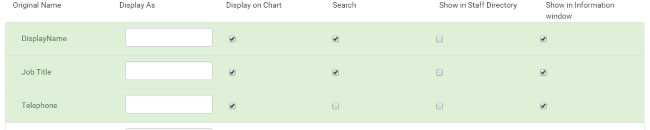
Selecting the Columns

Simply check the columns that you wish to appear on the chart.
There are the following options for each data column.
- Display on Chart - item will appear in the chart boxes
- Search - item will appear in the search results.
- Show in Directory - item will appear in the staff directory
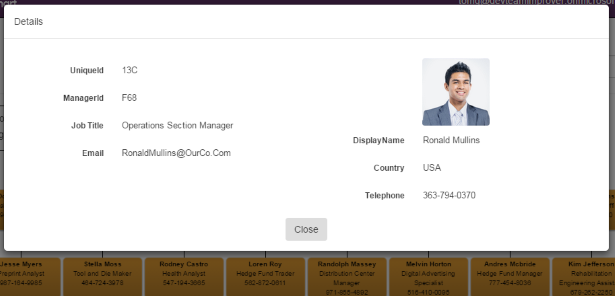
- Show in Information Window - item will appear in the popup information window.
The Picture Column is used to tell TeamOrgChart which column contains the URL to the profile picture.
Reordering the Columns
The column order can be set by dragging and dropping the choosen columns into order.
For best results it is recommneded to limit the number of columns shown in each box to two or three. If you wish show more information in the chart boxes then you may need to set a Custom Box Size to prevent the text spilling out of the boxes.
The Finished Chart
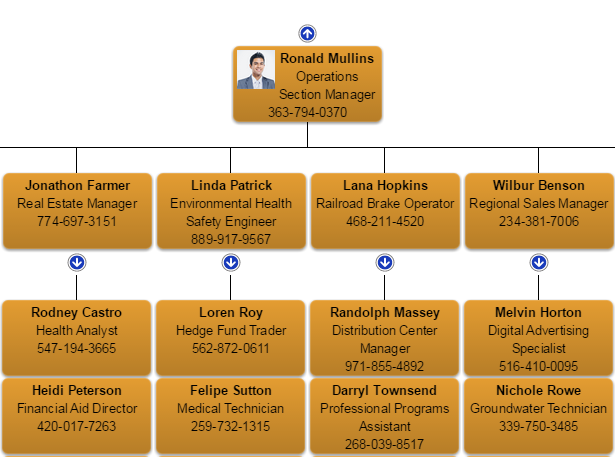
Once you have selected the desired information to display press Save Changes to update the chart.
The chart will be modified to reflect the changes. Clicking on a chart box will show the pop-up information window with the changes applied too.